Upleveling R Visualizations with Themes
R offers a number of packages that build on top of ggplot2 to generate themes and visualize that can enhance storytelling and data presentation. Having these tools in your arsenal can help you customize your charts tailored to your audience and allow you to tell a more compelling story.
This note explores a few packages and how to use them.
Base ggplot2
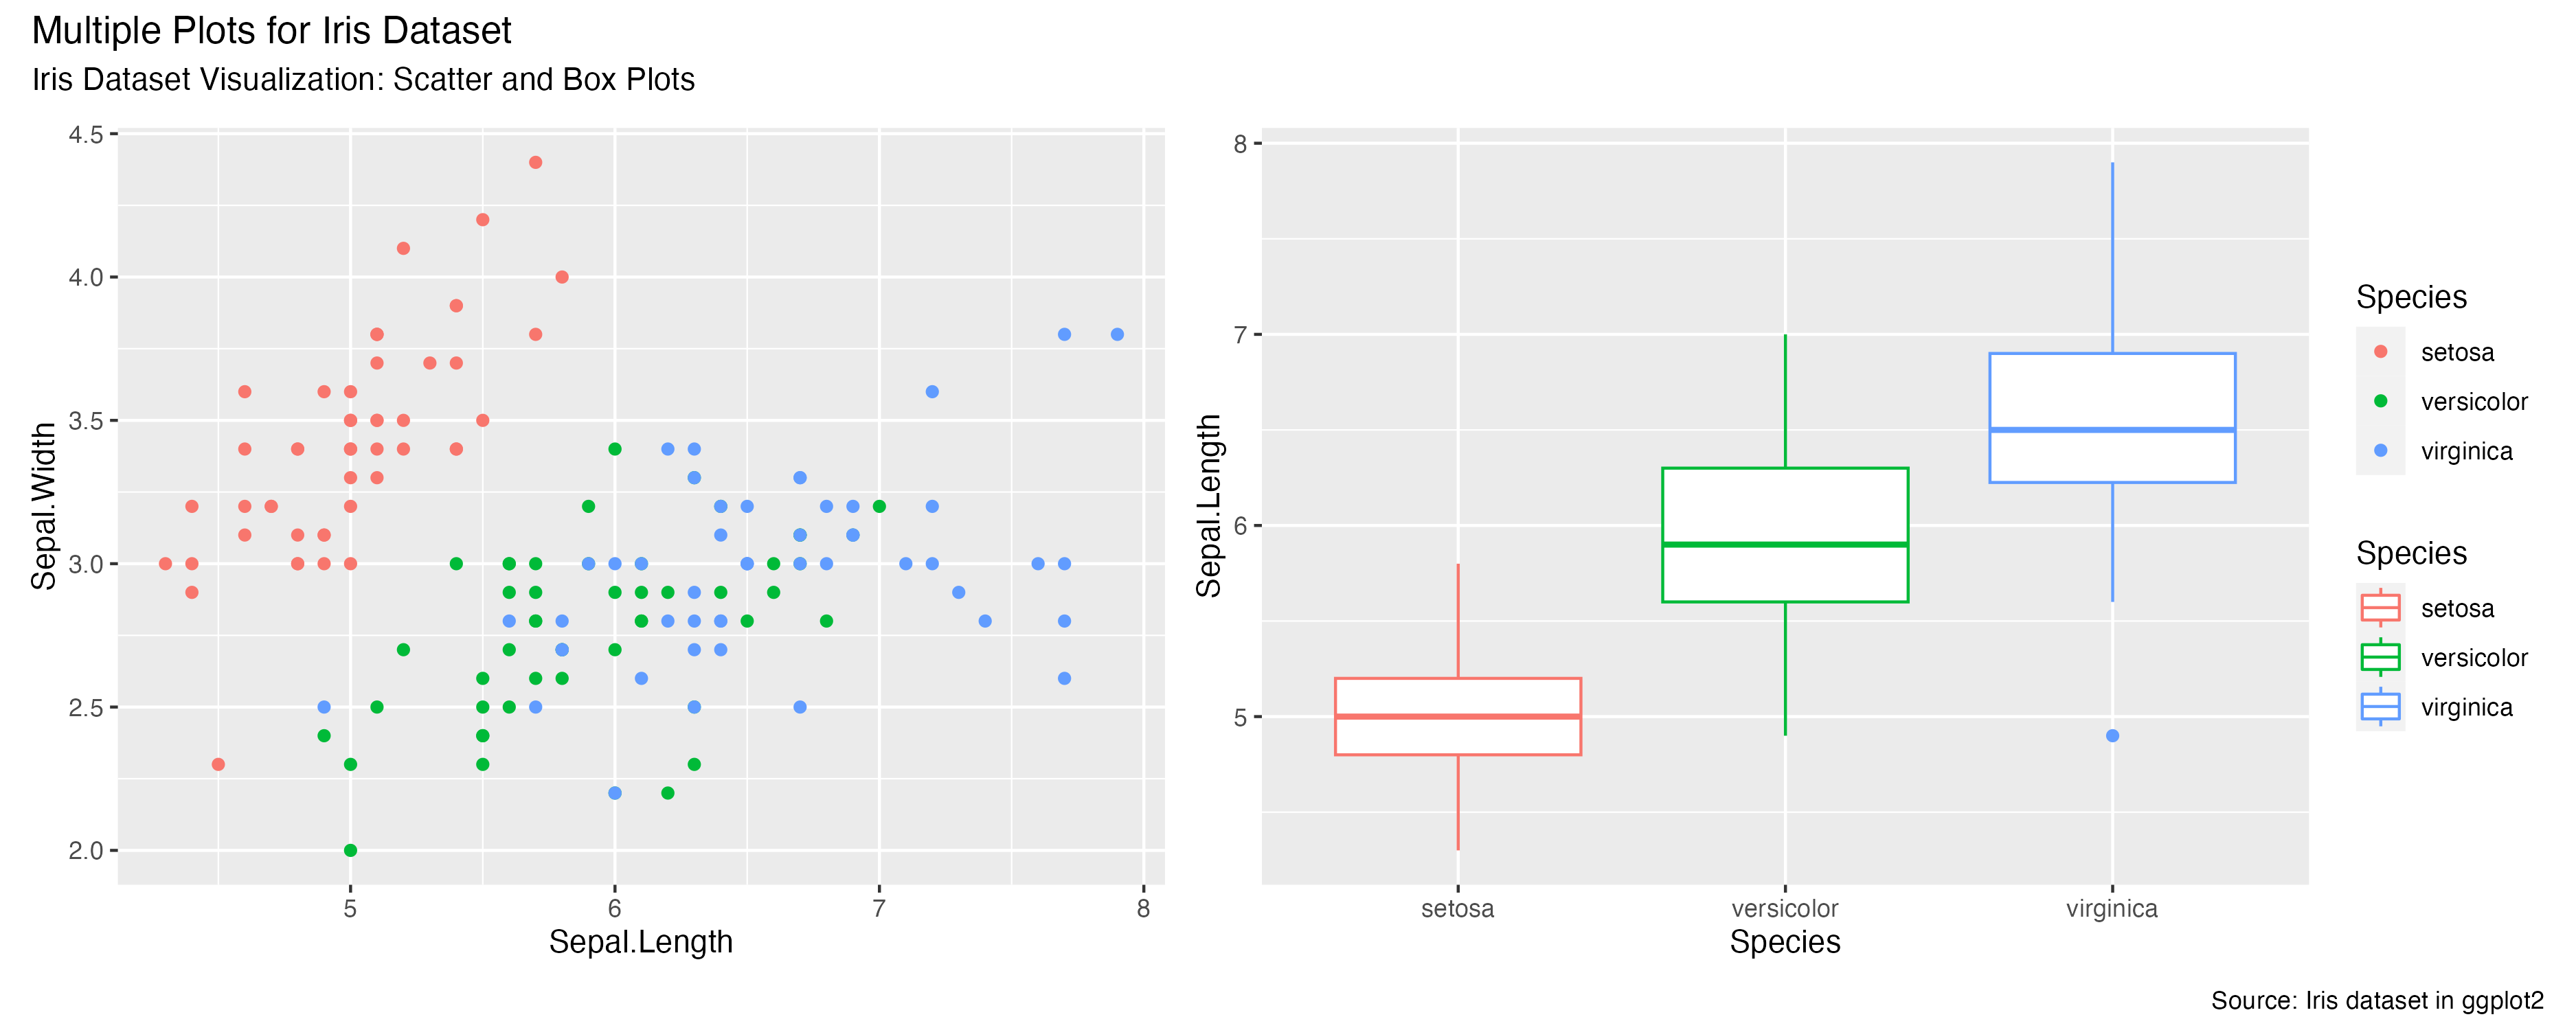
For demonstration, we begin with base ggplot2. In the example below, I generate multiple plots using the iris dataset.
## importing packages
library(datasets)
library(ggplot2)
library(patchwork)

# generating iris data plots
scatter = ggplot(data = iris, aes( x = Sepal.Length, y = Sepal.Width, color = Species)) + geom_point()
box = ggplot(data = iris, aes(  x=Species , y=Sepal.Length, color=Species )) + geom_boxplot()
density = ggplot(data = iris, aes( x=Sepal.Length, fill = Species )) + geom_density()
bar = ggplot(data = iris, aes( x=Species, y=Sepal.Length, fill=Species)) + geom_bar(stat = "identity")

# plotting using base ggplot
scatter + box + density + bar + plot_layout(guides = 'collect') +
    plot_annotation(
    title = "Multiple Plots for Iris Dataset",
    subtitle = "Iris Dataset Visualization: Scatter, Box, Bar and Density Plots",
    caption = "Source: Iris dataset in ggplot2"
    )
1. ggthemr
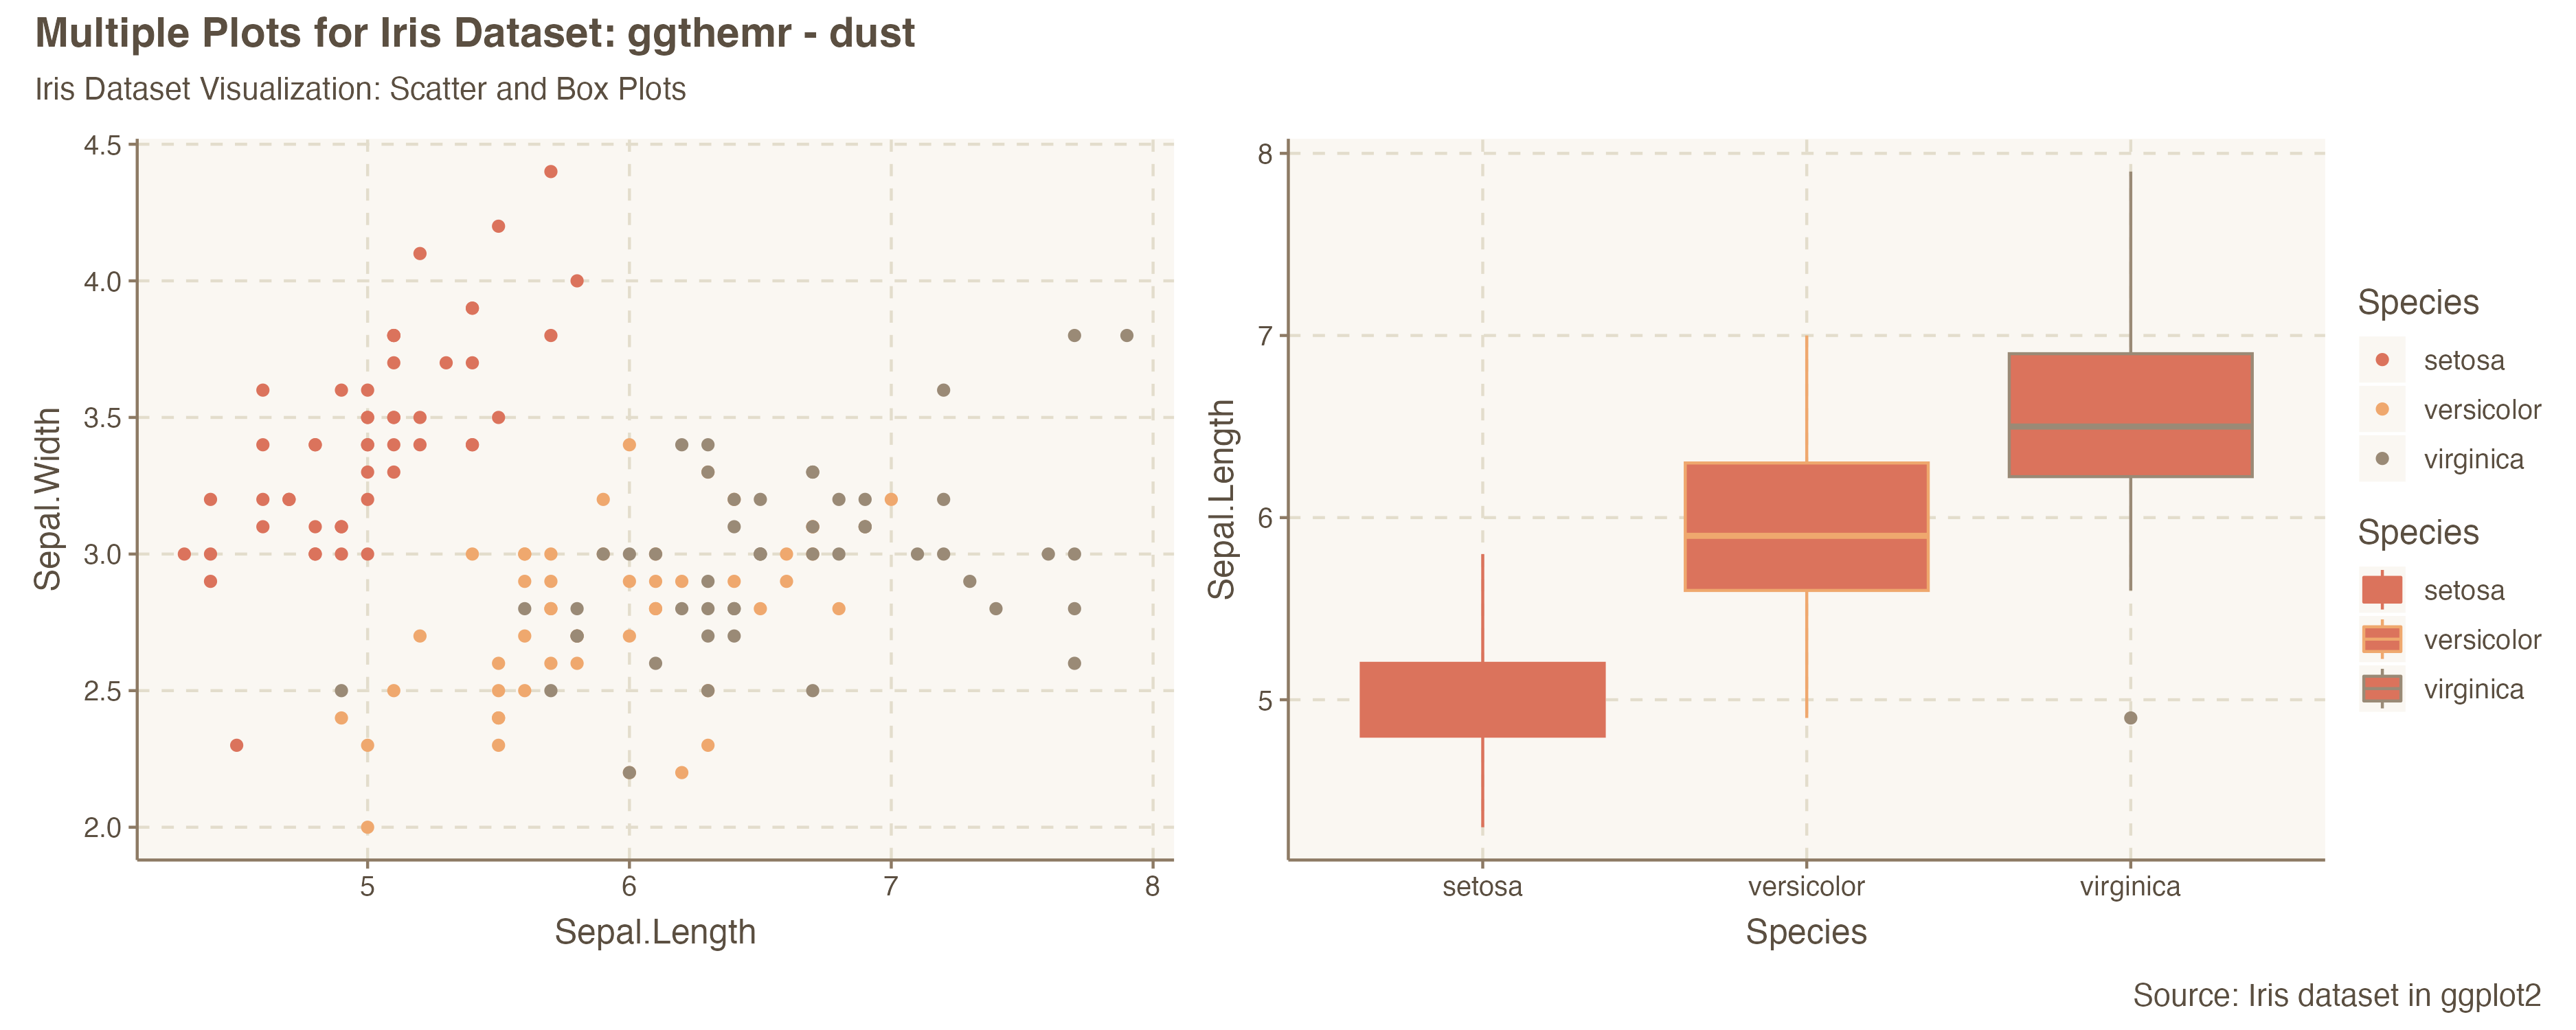
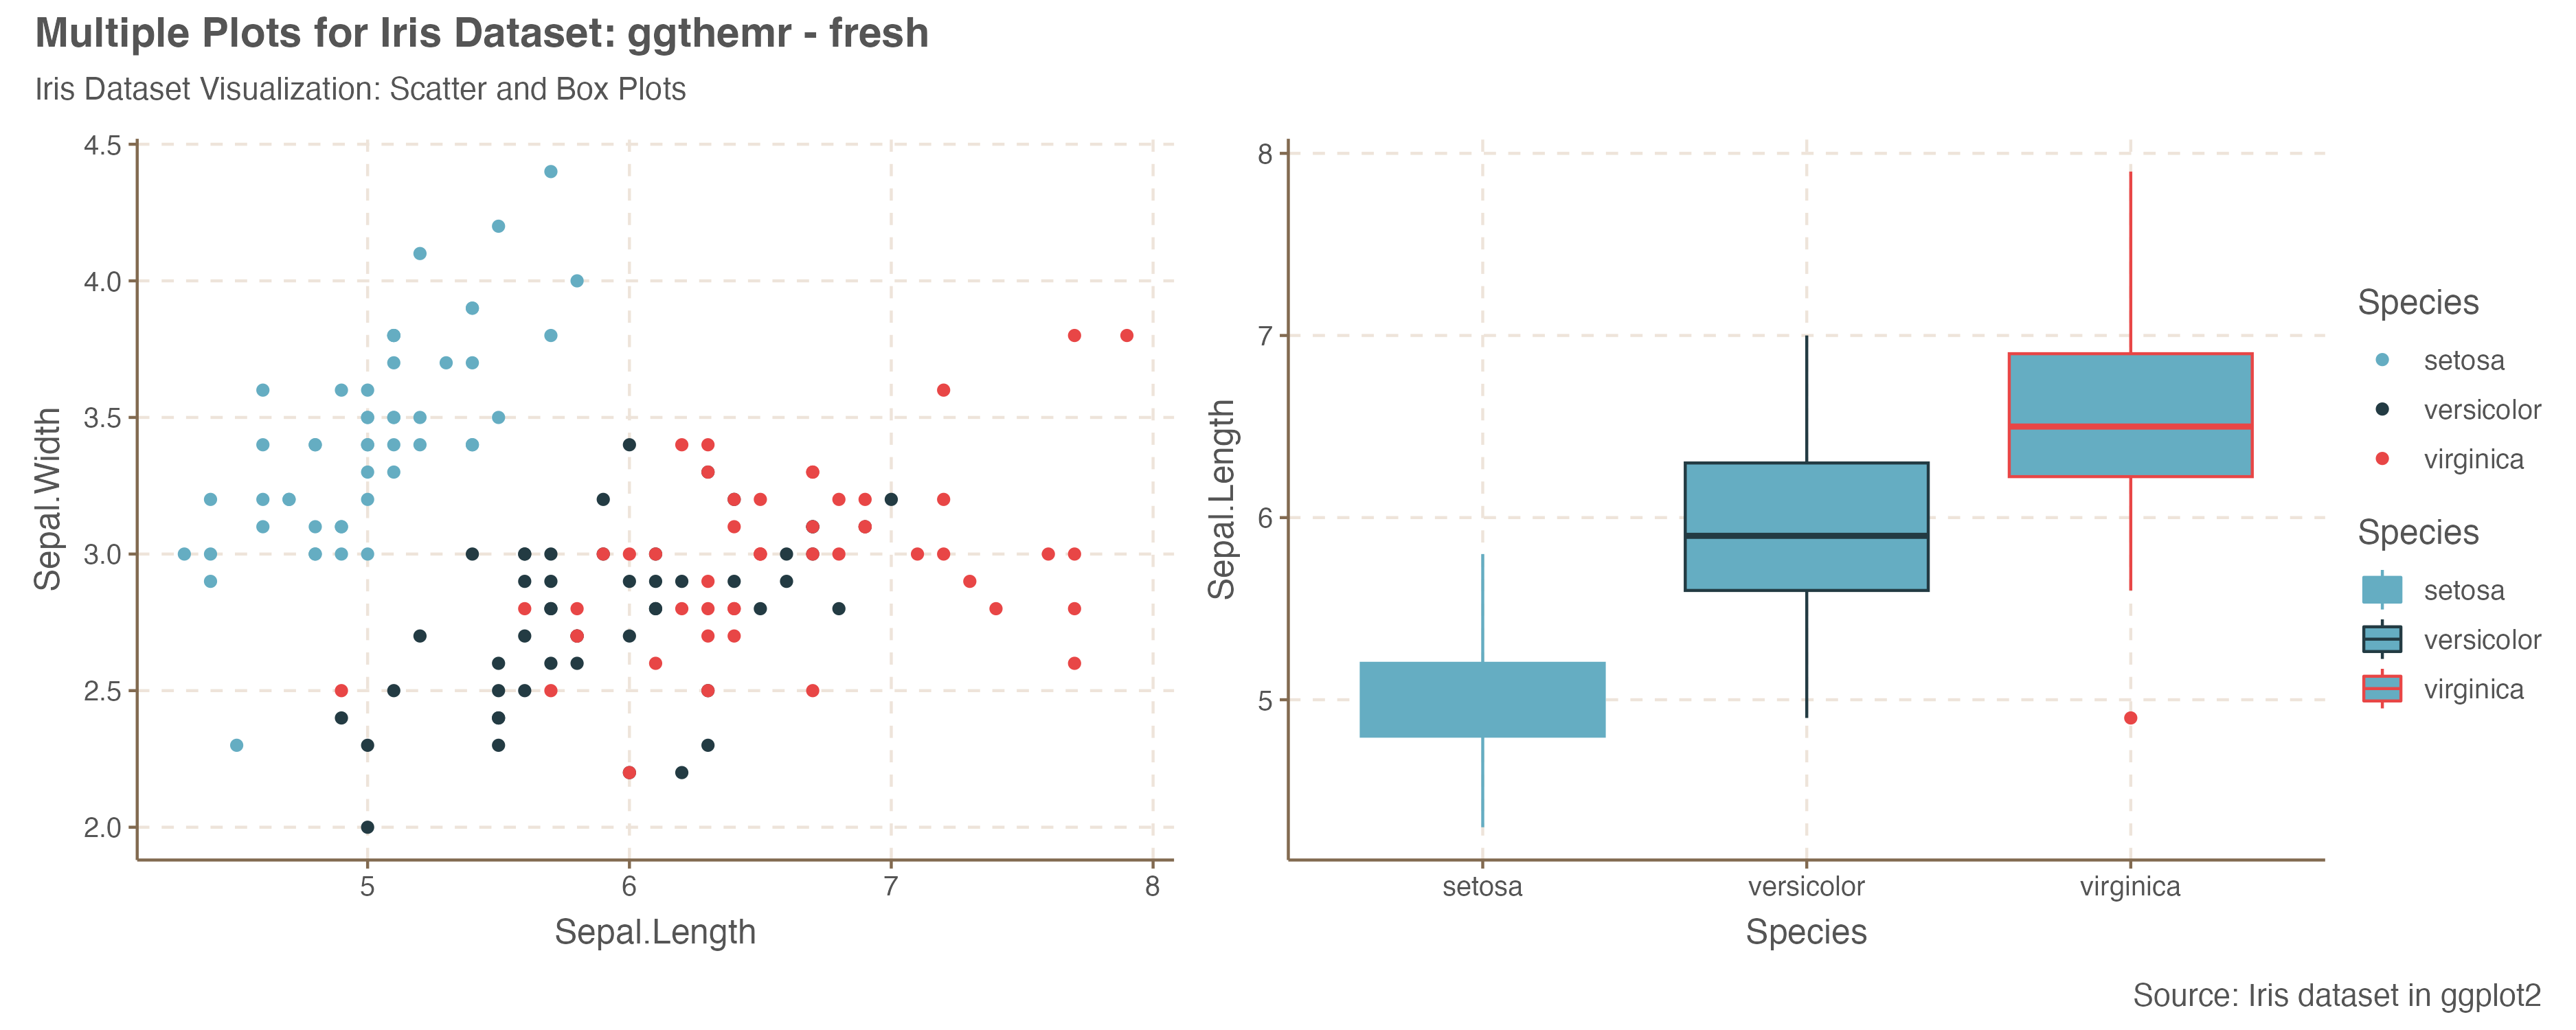
ggthemr offers a number of themes to adapt your visualization. The philosophy is simple: set the theme and forget about it. Every chart generated will follow the same theme. The packages offeres a number of impressive themes that are available here. The code below demonstrates the implementation of ggthemr using the dust and fresh themes.
ggthemr - dust theme
This is an example of how to implement the dust theme
 # loading and initializing the library for dust theme
library(ggthemr)
ggthemr('dust')

scatter + box + density + bar + plot_layout(guides = 'collect') +
  plot_annotation(
    title = "Multiple Plots for Iris Dataset - ggthemr theme",
    subtitle = "Iris Dataset Visualization: Scatter, Box, Bar and Density Plots",
    caption = "Source: Iris dataset in ggplot2"
) 
ggthemr - fresh theme
This is an example of how to implement the fresh theme
 # loading and initializing the library to render the fresh theme
library(ggthemr)
ggthemr('fresh')

scatter + box + density + bar + plot_layout(guides = 'collect') +
  plot_annotation(
    title = "Multiple Plots for Iris Dataset - ggthemr theme",
    subtitle = "Iris Dataset Visualization: Scatter, Box, Bar and Density Plots",
    caption = "Source: Iris dataset in ggplot2"
) 
2. ggthemes
The ggthemes package offers a variety of popular and well-known chart formats used in news organizations, academic publications, and even professional software. Some of these themes include The Economist, Stata, Tableau and the Wallstreet Journal.
ggtheme - Stata Theme
The example below uses that stata theme that comes with ggthemes to show how charts render. We use the same plots as the previous section.
library(ggthemes)
library(datasets)
library(ggplot2)
library(patchwork)

# generate charts with the theme
scatter = ggplot( data = iris, aes( x = Sepal.Length, y = Sepal.Width, color = Species)) +
                  geom_point() + theme_stata() +
                  ggtitle("Scatter Plot: Sepal Length to Width")


box = ggplot( data = iris, aes(  x=Species , y=Sepal.Length, color=Species )) +
              geom_boxplot()  +
              ggtitle("Box Plot: Sepal Length")

scatter + box  + theme_stata()
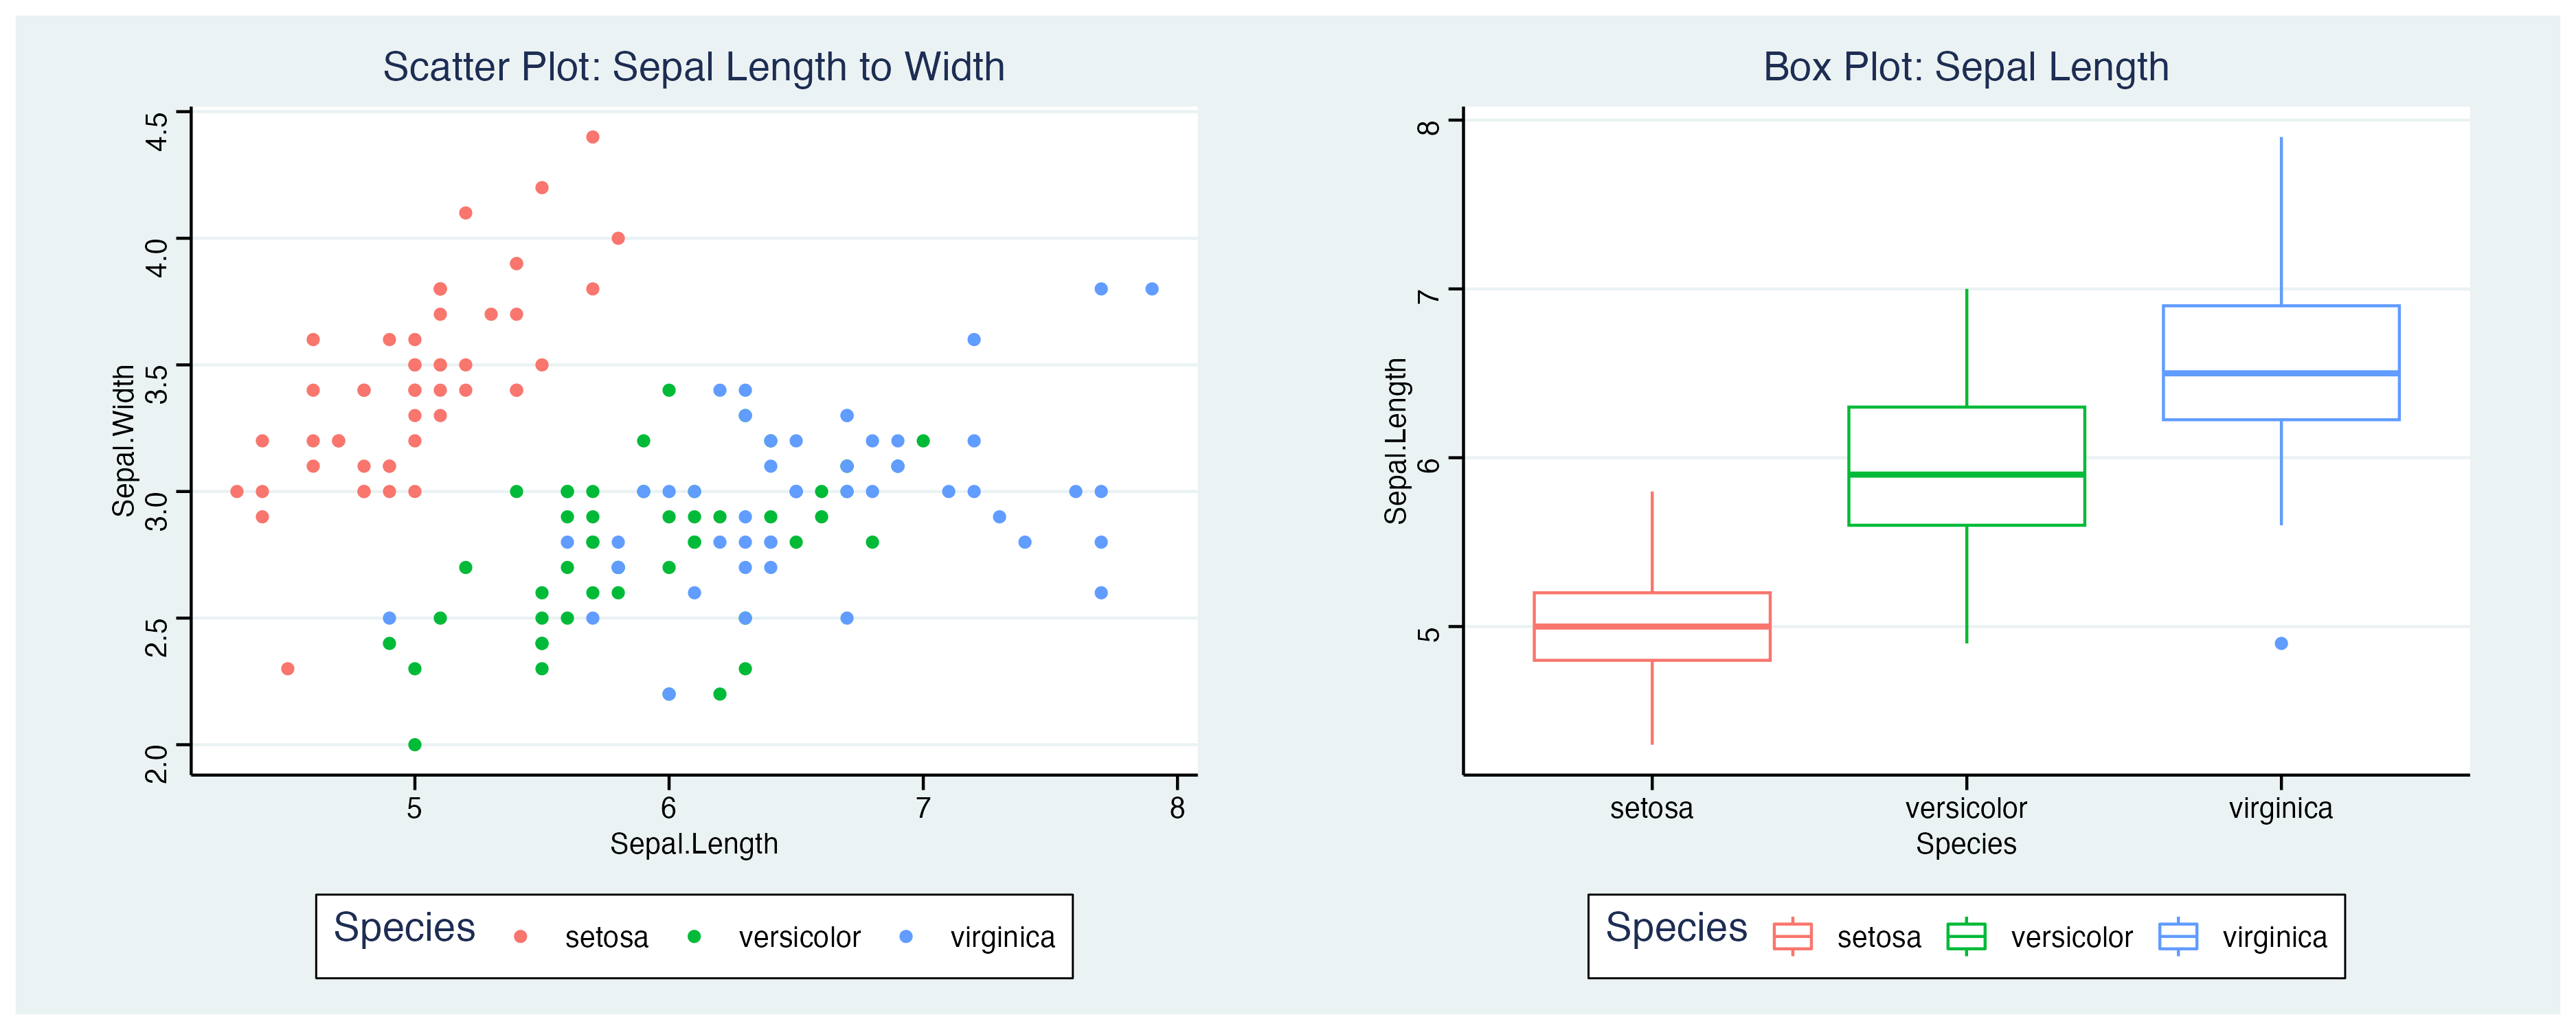
3. hrbrthemes
The hrbrthemes is another alternative that focuses on providing typography-centric themes and theme components for ggplot2. It has a number of font selection and themes to go with it. In the example below, I replicate the scatter and box plots using hrbrthemes' theme_ipsum()
library(datasets)
library(ggplot2)
library(patchwork)
library(hrbrthemes)

# generate charts with the theme_ipsum()
scatter = ggplot( data = iris, aes( x = Sepal.Length, y = Sepal.Width, color = Species)) +
    geom_point() + theme_ipsum() +
    ggtitle("Scatter Plot: Sepal Length to Width") +
    theme(plot.title = element_text(size = 15))


box = ggplot( data = iris, aes(  x=Species , y=Sepal.Length, color=Species )) +
    geom_boxplot()  +
    ggtitle("Box Plot: Sepal Length")

scatter + box  + plot_layout( guides = "collect" ) +  theme_ipsum() +
    theme(plot.title = element_text(size = 15))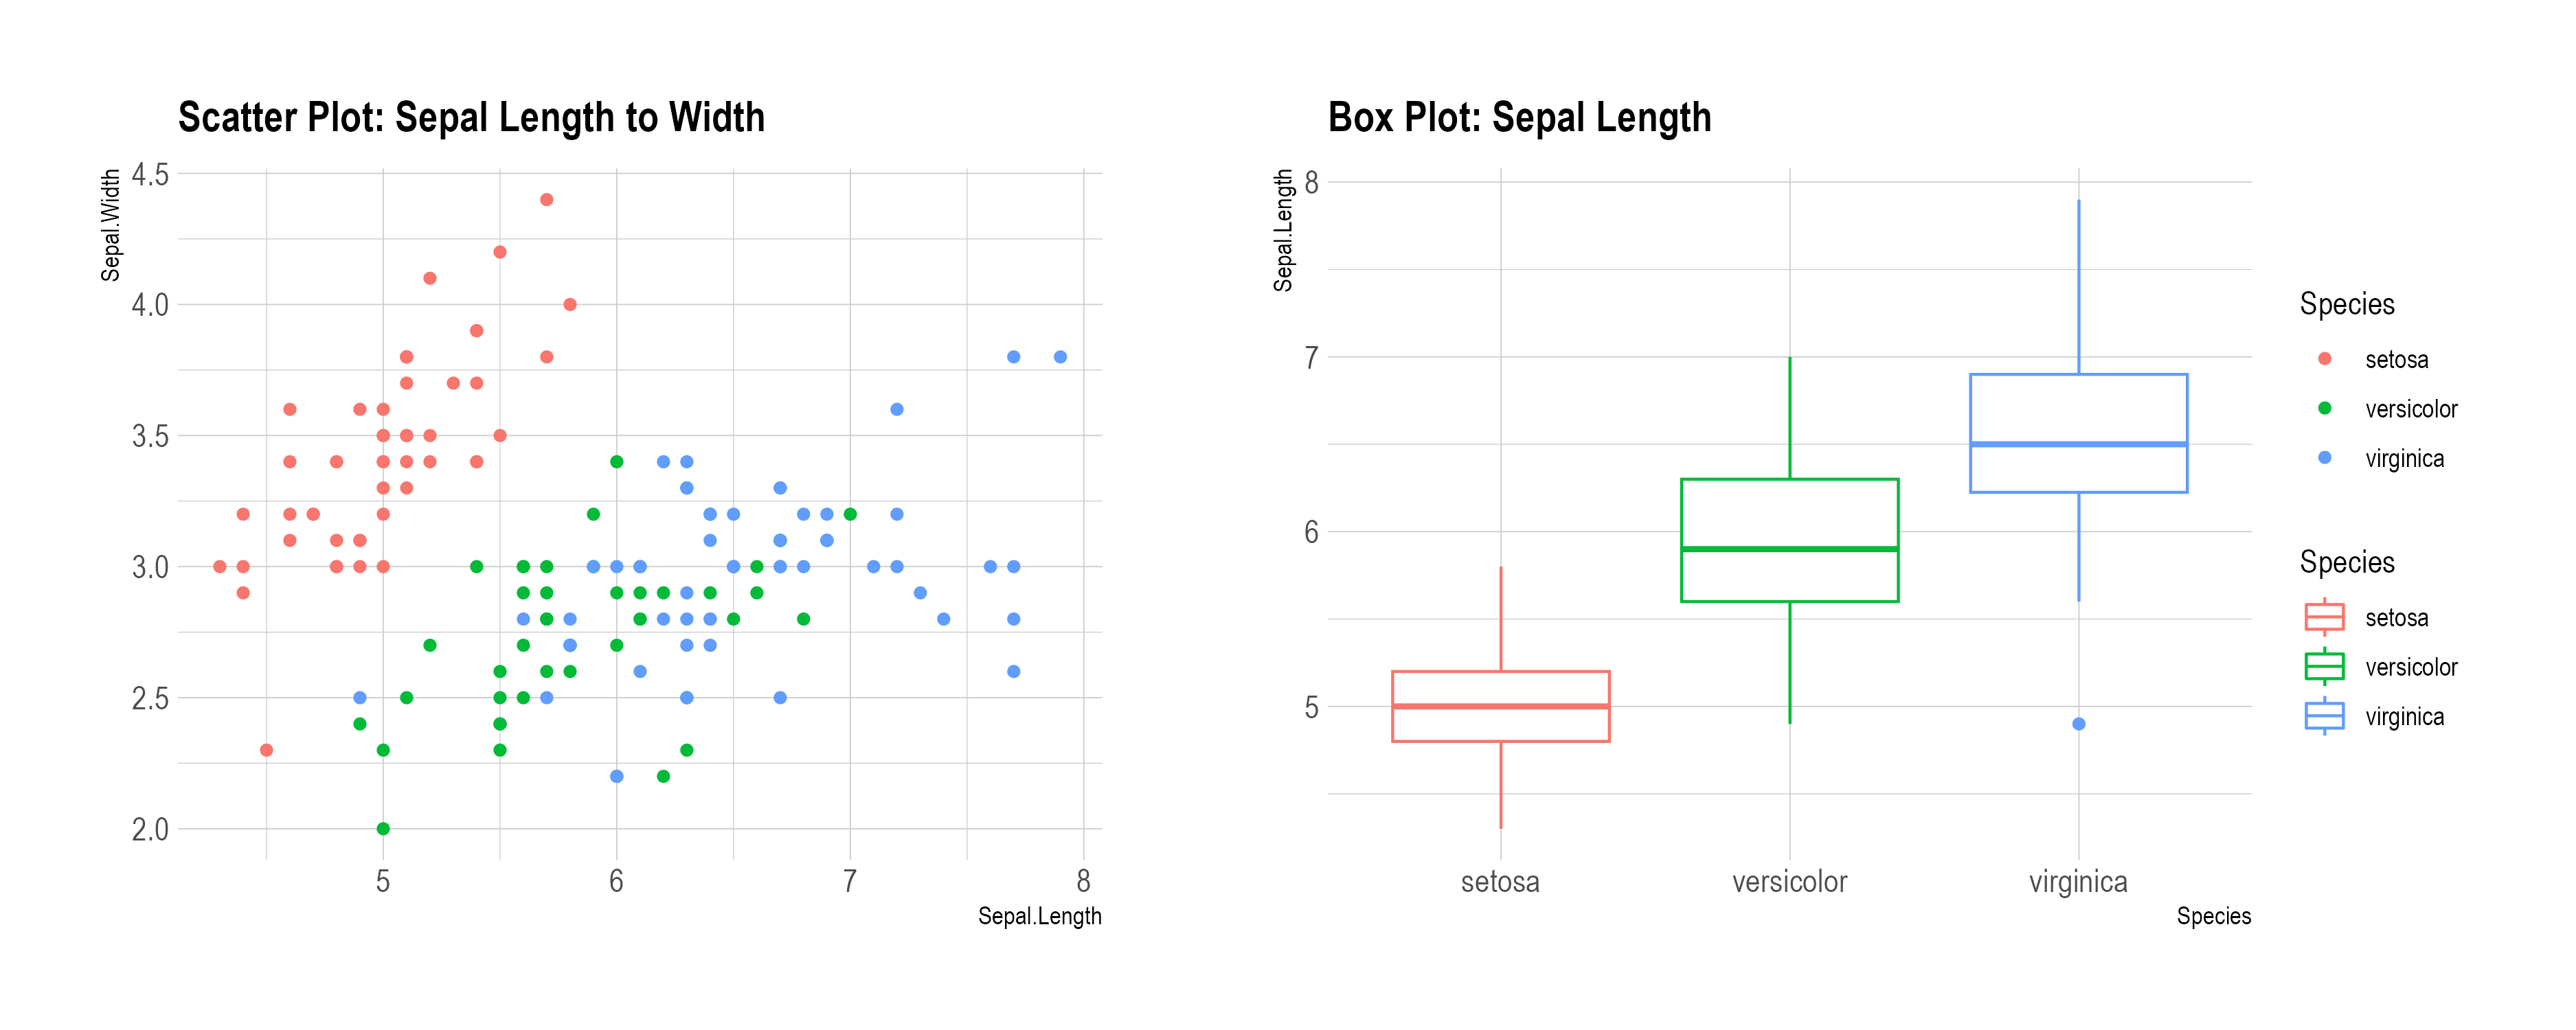
4. ggtech package
The ggtech offers themes that match the design elements of some of the largest tech companies. The package offers a combination of fonts and colors used by Facebook, Google, Twitter, Airbnb, and Etsy. The example below demonstrates the implementation of Google and Facebook on the iris dataset.
library(ggtech)
library(ggplot2)
library(datasets)
library(patchwork)


# google theme
scatter = ggplot(data = iris,
                 aes( x = Sepal.Length, y = Sepal.Width, color = Species)) +
                 geom_point() + theme_tech(theme="google") +
                 scale_fill_tech(theme="google")  +
                 labs( title="Iris Scatter Plot: Google theme")

# Facebook theme
box = ggplot(data = iris,
             aes(  x=Species , y=Sepal.Length, fill=Species )) +
             geom_boxplot() +
             theme_tech(theme="facebook") +
             scale_fill_tech(theme="facebook") +
             labs( title="Iris Scatter Plot: Facebook theme")

scatter + box + plot_layout(guides = "collect")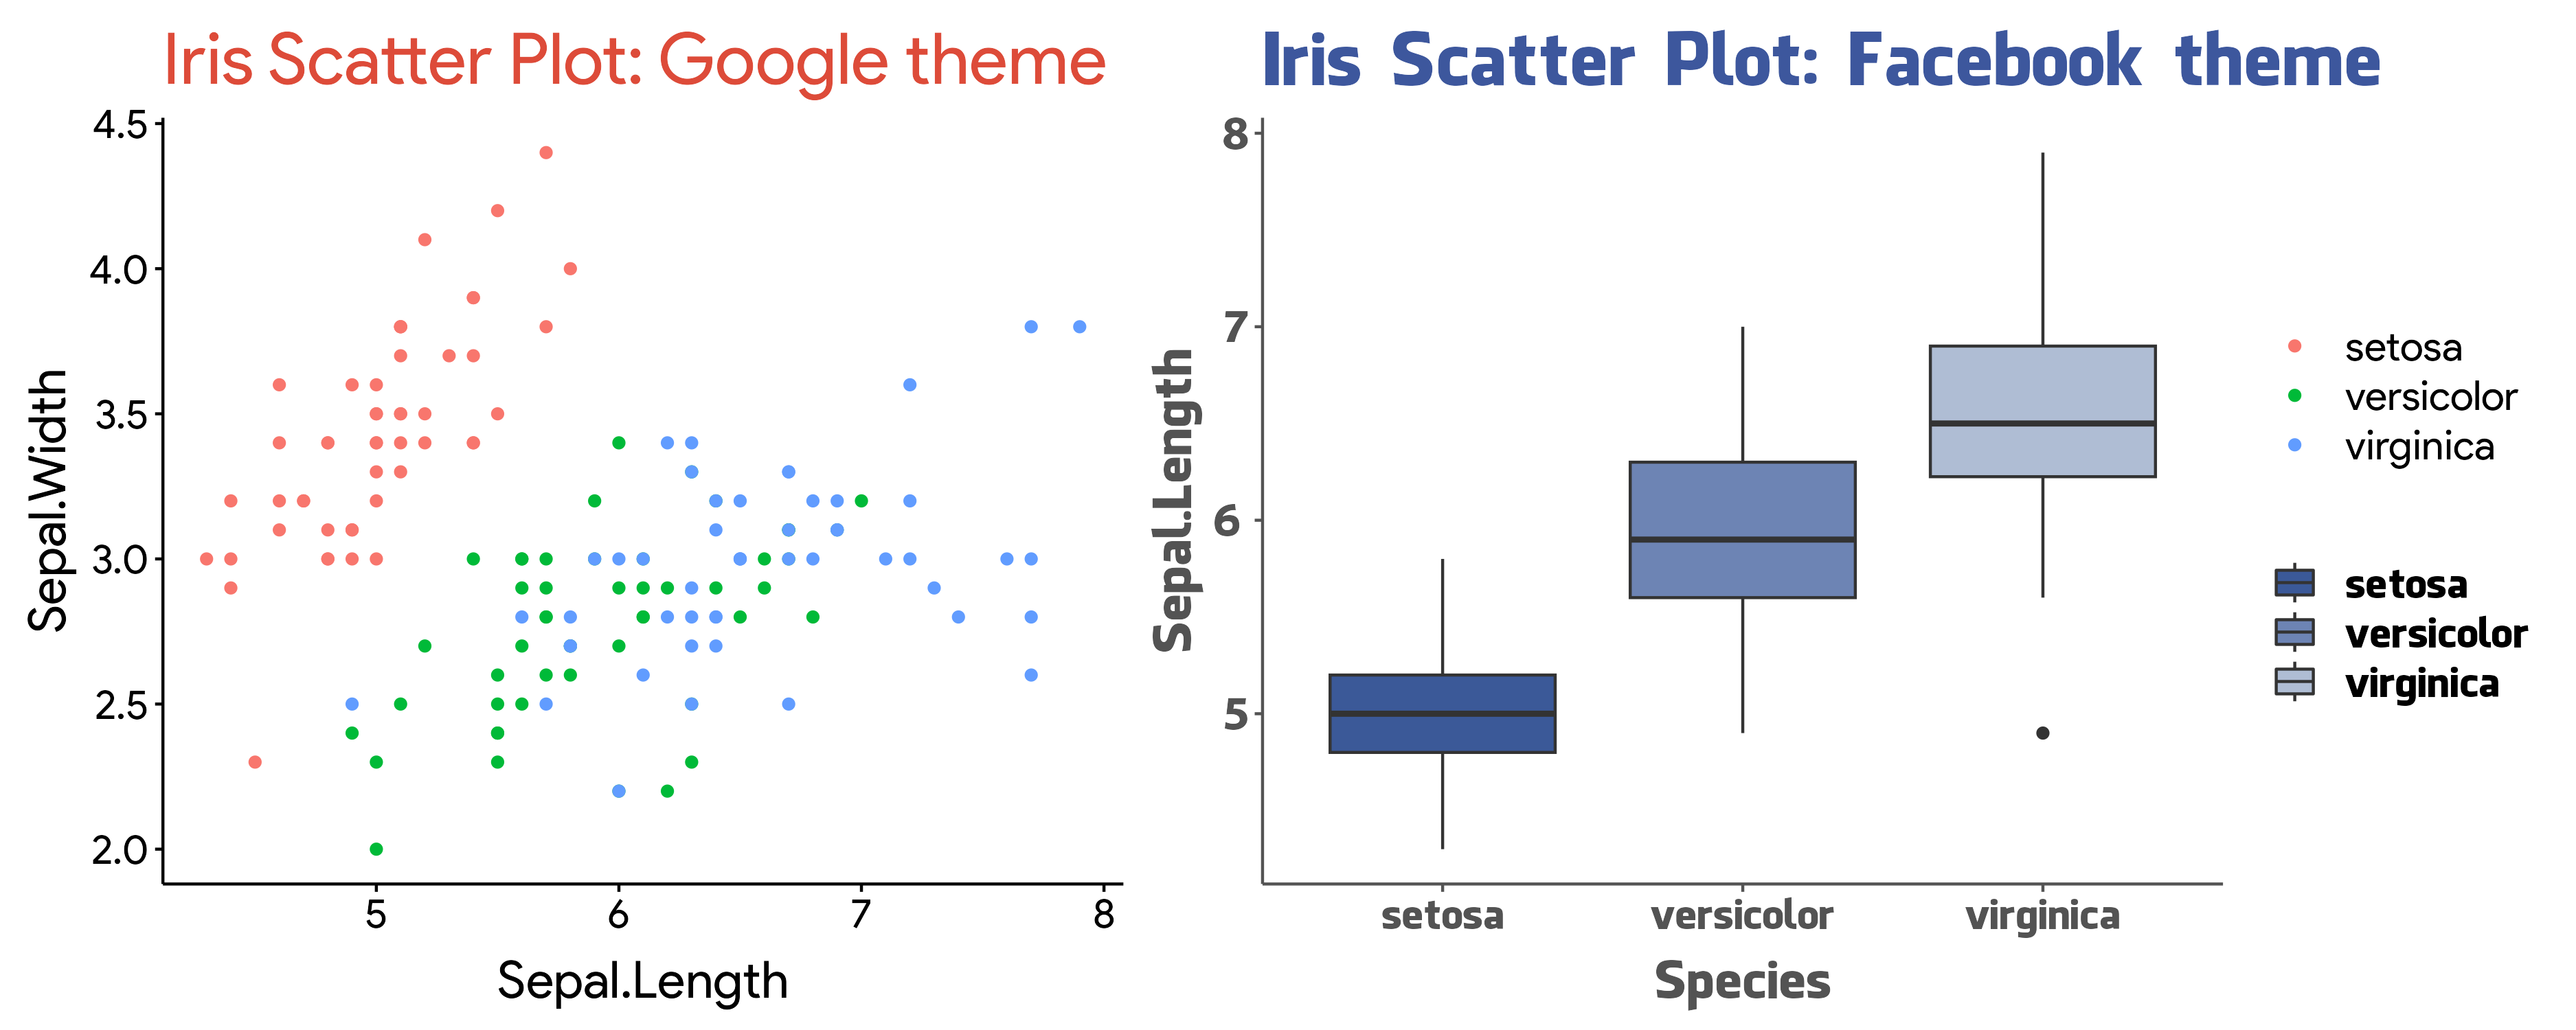
5. artyfarty library
The artyfarty library focuses on providing easy access to a few ‘nice’ ggplot themes, it also includes a number of predefined palettes and watermark convenience functions.
Some of the themes include:
- dataroots
- Vroom
- bain
- monokai
A full list is available here
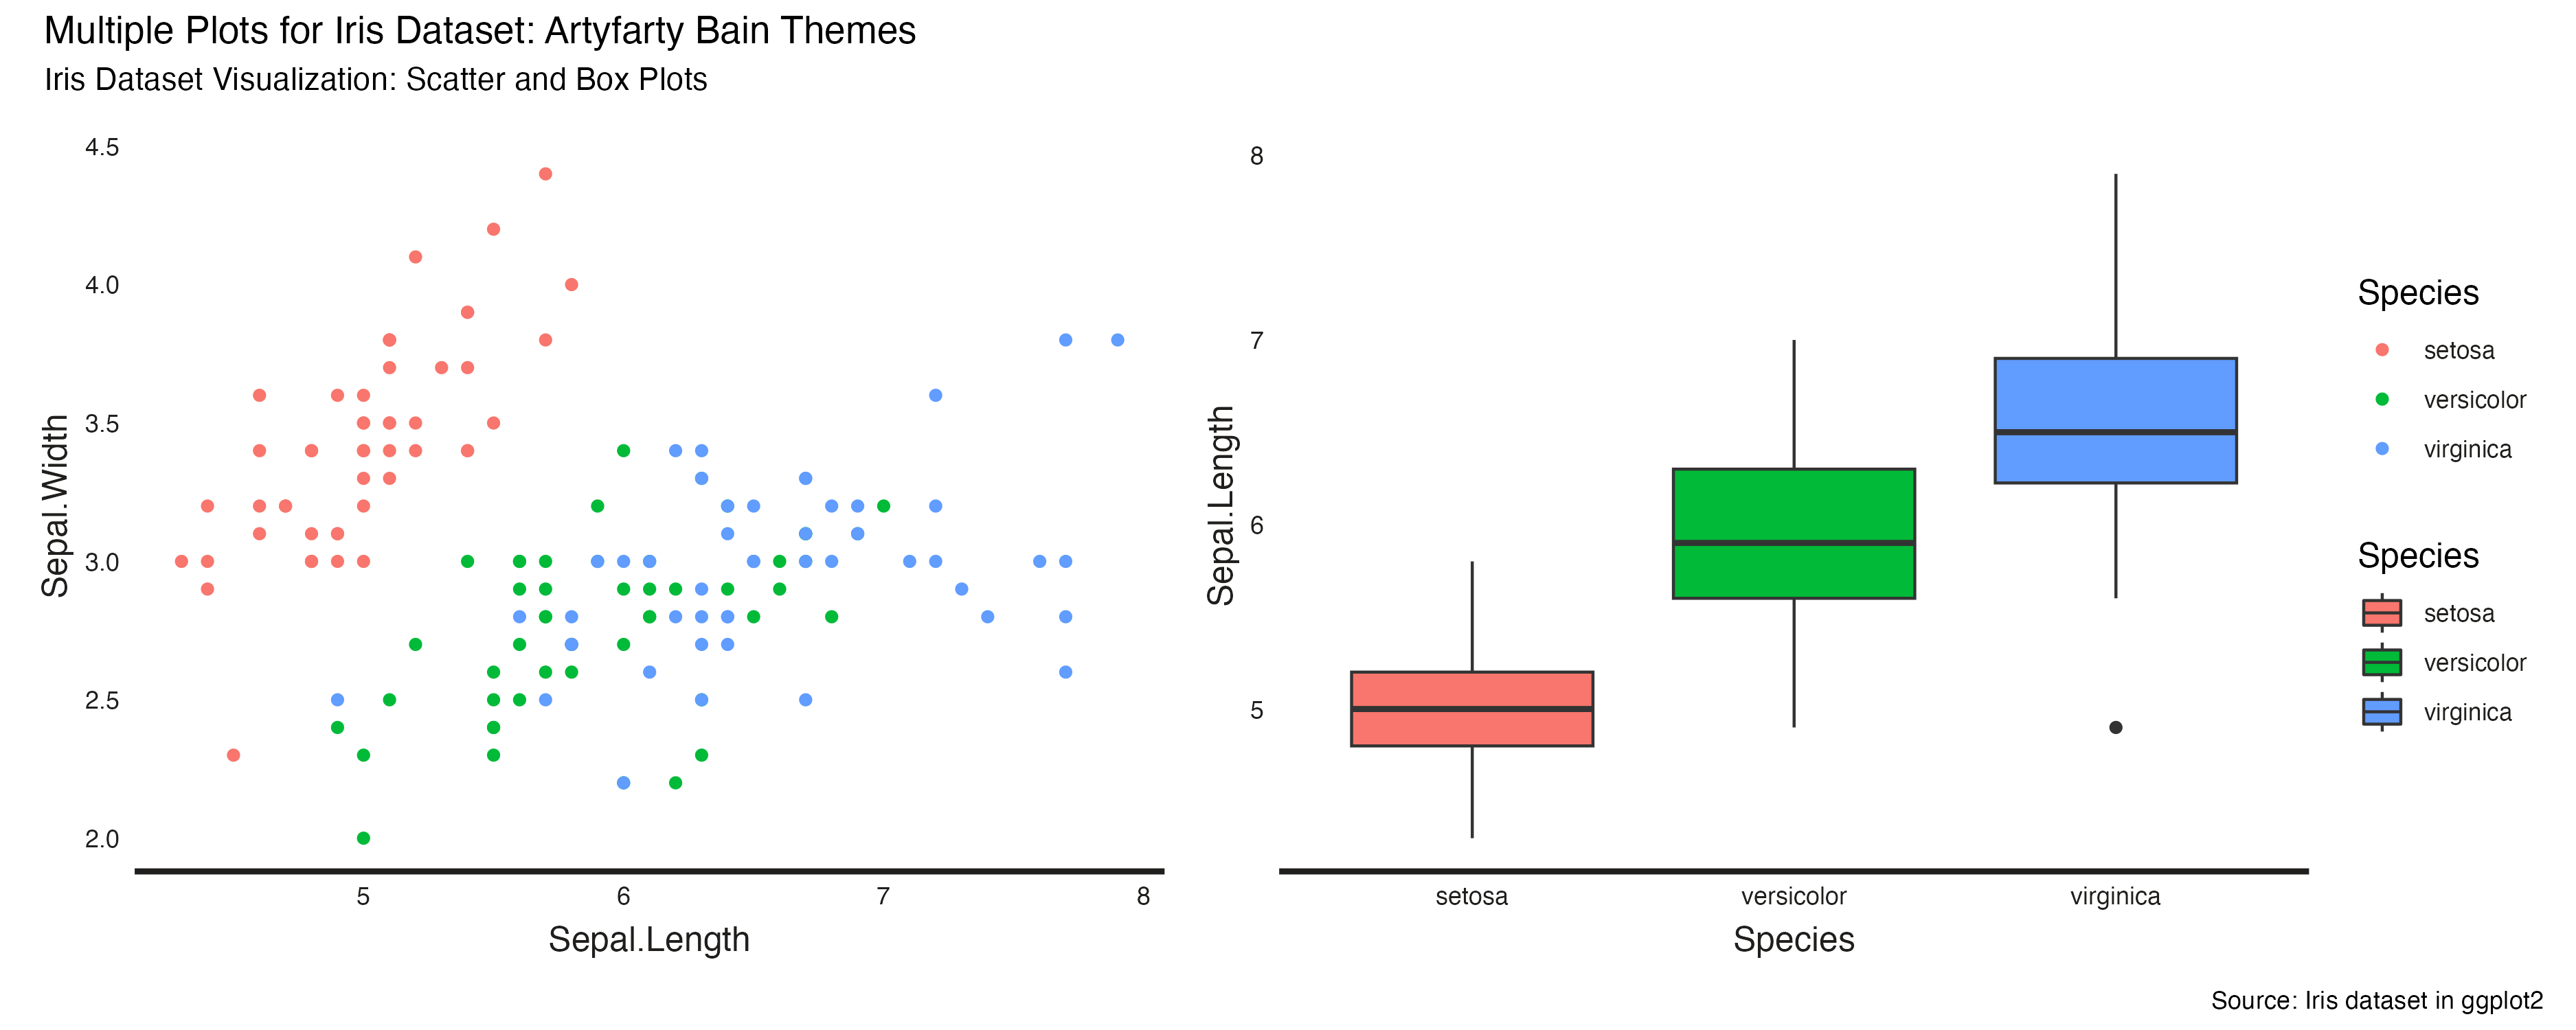
The example below demonstrates the implementation of the bain theme on iris dataset
library(datasets)
library(ggplot2)
library(patchwork)
library(artyfarty)

# building the scatter and box plots
scatter = ggplot(data = iris,
                    aes( x = Sepal.Length, y = Sepal.Width, color = Species)) +
                    geom_point() +
                    theme_bain()

box = ggplot(data = iris,
                aes( x=Species , y=Sepal.Length, fill=Species )) +
                    geom_boxplot() +
                    theme_bain()

scatter + box +
    plot_layout(guides = 'collect') +
    plot_annotation(
    title = "Multiple Plots for Iris Dataset: Artyfarty Bain Themes",
    subtitle = "Iris Dataset Visualization: Scatter and Box Plots",
    caption = "Source: Iris dataset in ggplot2"
) 
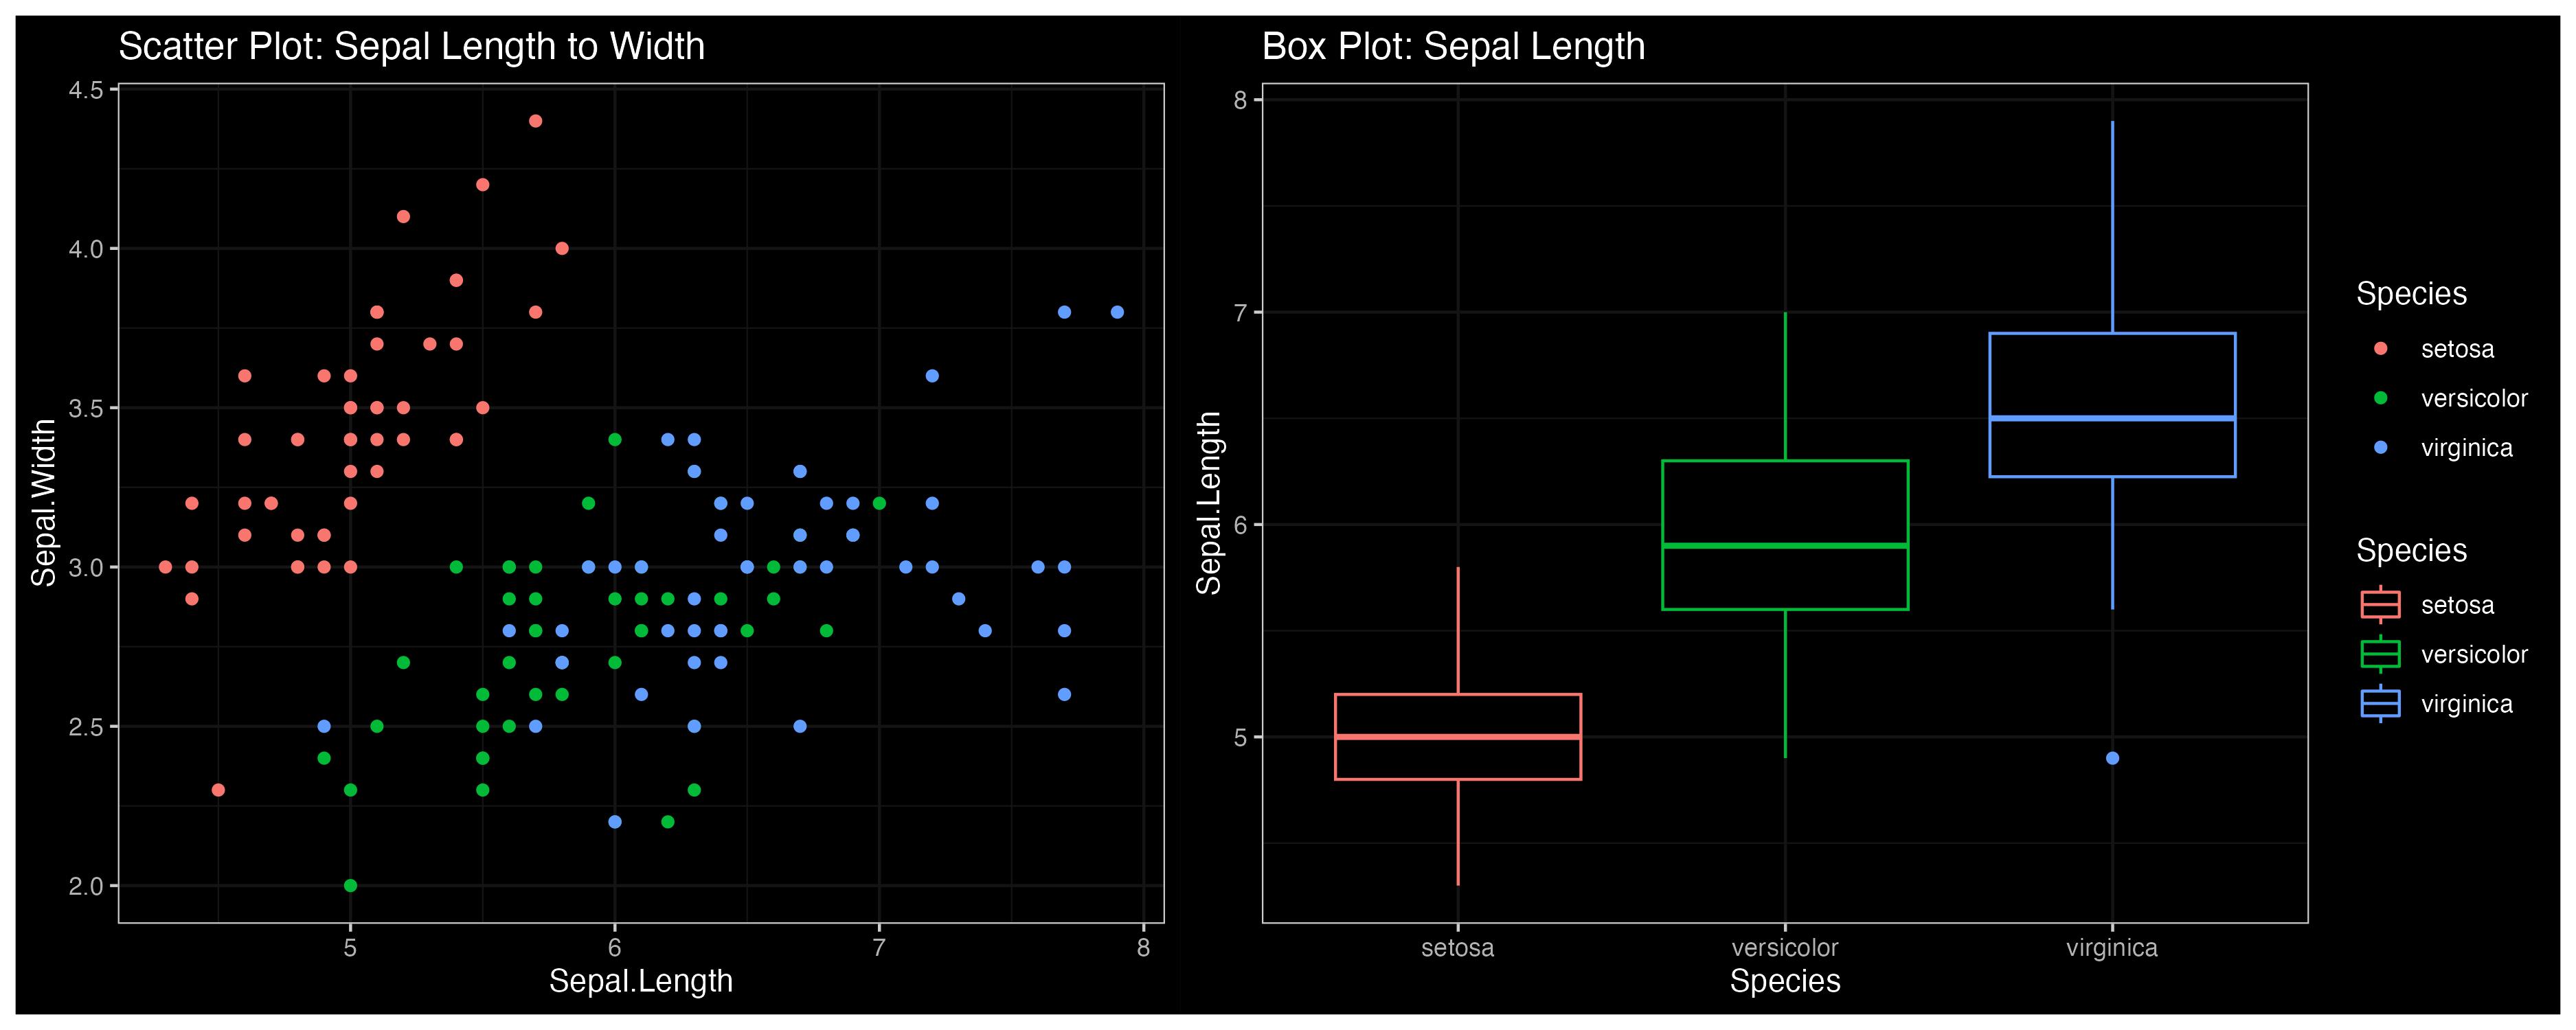
6. ggdark library
ggdark offers customizable templates to add dark and gray themes to your ggplots. It can also be used to overlay other themes with a dark background. This example demonstrates the implementation of dark_theme_bw() on iris dataset plots
library(ggplot2)
library(ggdark)
library(datasets)

scatter = ggplot(data = iris,
                    aes( x = Sepal.Length, y = Sepal.Width, color = Species)) +
                    geom_point() +
                    ggtitle("Scatter Plot: Sepal Length to Width")  +
                    dark_theme_bw()

box = ggplot(data = iris,
                aes(  x=Species , y=Sepal.Length, color=Species )) +
                geom_boxplot() +
                ggtitle("Box Plot: Sepal Length") + dark_theme_bw()

scatter + box + plot_layout(guides = "collect")